In the previous article Tech FAQ: Why Is CPU Utilization Low, Yet the VMs Keep Lagging?, we explained why low CPU utilization can still coincide with slow system response and frequent VM lag in a virtualized environment, and introduced CPU Ready Wait Time Percentage, an often-overlooked monitoring metric.
To address VM lag, SmartX Enterprise Cloud Platform (SmartX ECP) provides a closed-loop solution based on CloudTower’s observability platform, covering VM lag monitoring, alerting, and optimization.
Without deploying additional agent plug-ins, O&M teams can continuously monitor VM CPU scheduling status within the platform, combine it with custom alerts and notification policies, and identify resource contention risks in time, shifting troubleshooting from passive feedback to proactive governance.
- Monitoring: Integrates key metrics such as CPU Ready Wait Time Percentage, host CPU utilization, and cluster CPU overcommitment ratio to monitor compute resource usage from multiple dimensions.
- Alerting: Supports custom alert thresholds and alert rules, and delivers alert messages within seconds through multiple channels such as email, SNMPTrap, and Webhook.
- Optimization: Combines multidimensional O&M monitoring capabilities, such as the Inspection Center and historical load data, to continuously optimize VM configurations and cluster resource distribution for long-term governance.
Native Monitoring of CPU Utilization: Multidimensional, Customizable, One-Stop, and Lightweight
With CloudTower’s native monitoring capabilities, users can collect compute resource metrics, set thresholds, and configure rules in a customizable, one-stop manner, enabling lightweight O&M.
Metric Collection
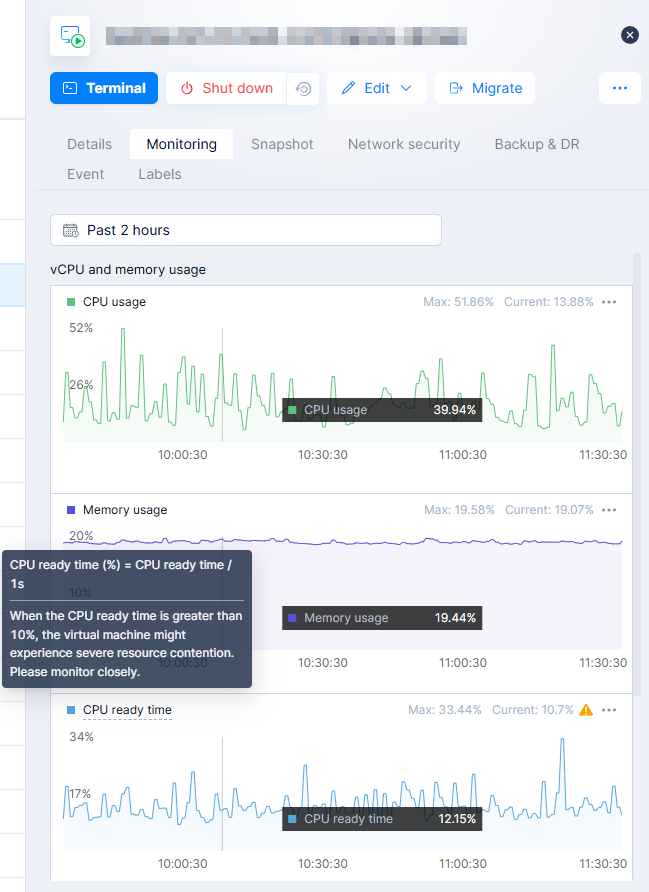
O&M teams can go to the [Monitoring] tab on the VM details page, open [Compute Performance], and directly view multiple metrics including host CPU utilization, cluster CPU overcommitment ratio, and CPU Ready Wait Time Percentage. In particular, the [CPU Ready Wait Time Percentage] chart clearly shows whether the VM has CPU scheduling wait issues.
Threshold Setting
After collecting metrics, O&M teams can refer to industry best practices and use a three-level alerting strategy to accurately distinguish risk levels:
- Noted: CPU Ready Wait Time Percentage > 5%, lasting for 5 minutes.
- Warning: CPU Ready Wait Time Percentage > 10%, lasting for 3 minutes.
- Critical: CPU Ready Wait Time Percentage > 15%, lasting for 1 minute.
Meanwhile, users can combine related metrics such as host CPU utilization and cluster CPU overcommitment ratio for auxiliary judgment. For example, when host CPU utilization remains above 80% for 15 minutes, or when the cluster CPU overcommitment ratio exceeds 3:1, it usually indicates that the underlying resources are already under high pressure.
Alert Rule Configuration
In addition, users can customize the [Rule Content] section under [Alerts] – Create [Custom Alert].
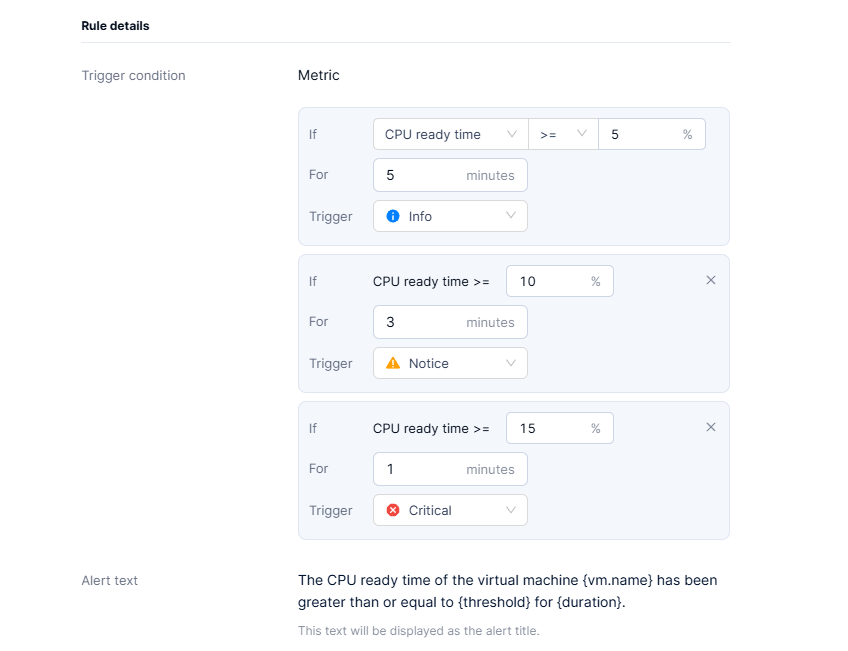
When configuring custom alert rules, users can follow these principles:
- Filter objects by business tags: Manage critical business VMs, such as core production, database, and business system VMs, separately.
- Select monitoring metrics: Bind the core metric [CPU Ready Wait Time Percentage].
- Filter invalid alerts: Trigger alerts only after thresholds are exceeded for multiple consecutive sampling periods to avoid transient fluctuations.
- Alert escalation: Automatically escalate critical alerts and push them to the O&M owner.
>> Learn more: CPU Resource Partitioning in SmartX ECP: Balancing Between Stability, Performance, and Cost
Alert Notifications: Multi-Channel Delivery Within Seconds
When potential risks are identified by the monitoring system, ensuring that alert information reaches the responsible person in time and drives a rapid response is also a top priority in VM O&M.
SmartX ECP supports pushing alerts to an enterprise’s existing monitoring platforms, O&M systems, or IM tools through multiple channels such as email, SNMPTrap, and Webhook, helping users build a unified O&M message center.
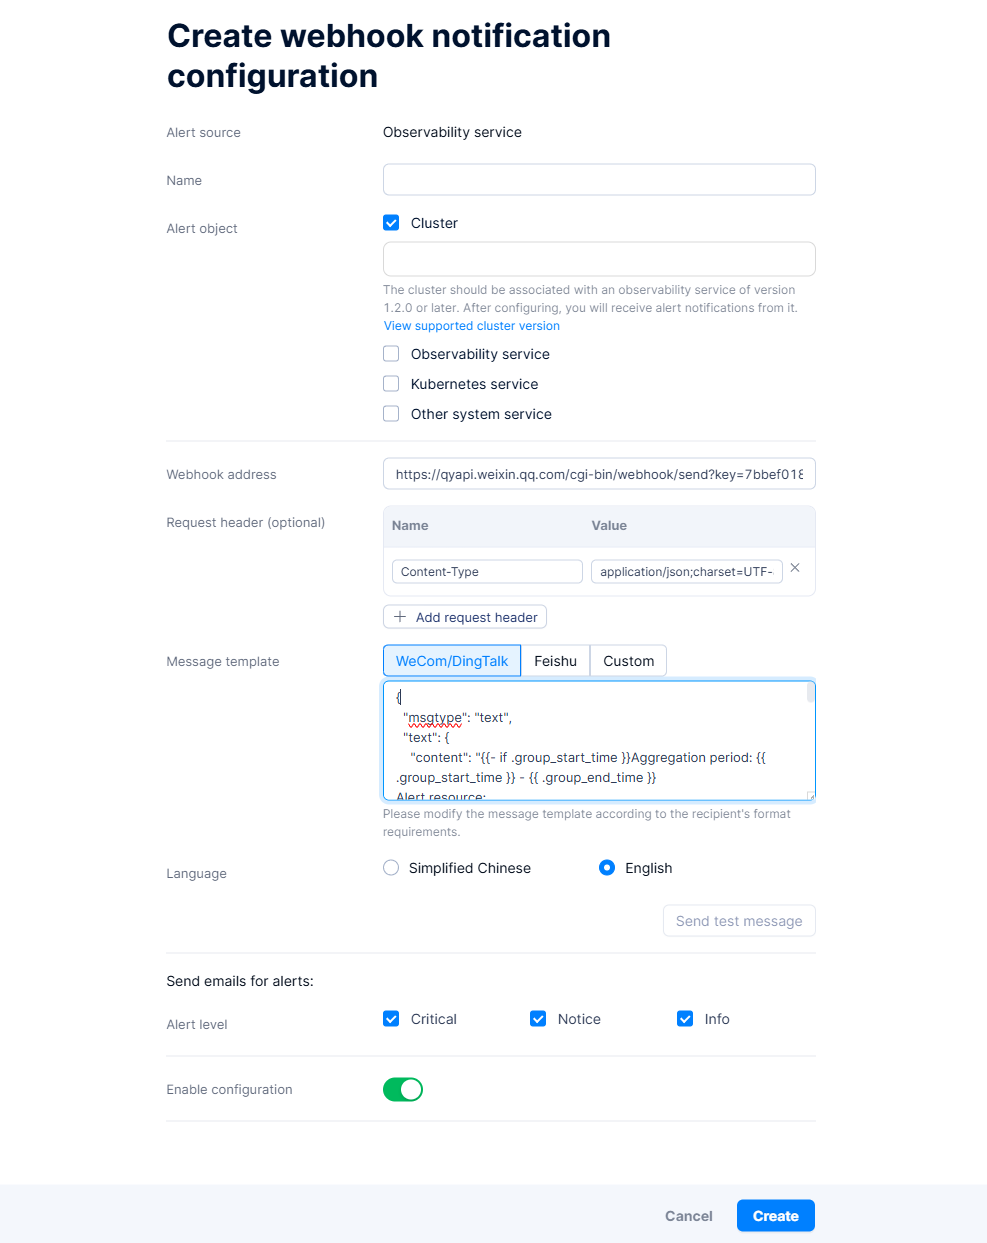
For daily O&M, enterprises can combine Webhook with a WeCom group bot. This provides a lightweight architecture, zero-cost scalability, and alert delivery within seconds. The overall notification chain is: CloudTower sends an alert -> Webhook API -> WeCom group bot -> O&M group / designated owner. The configuration process is as follows:
#1 Create a WeCom Group Bot
- Enter the dedicated O&M WeCom group and open the group settings.
- Select [Add Group Bot] and customize the name, for example: SmartX ECP Alert Assistant.
- Generate and copy the dedicated Webhook link, and save it for later use.
#2 Bind Webhook Notifications in CloudTower
- Log in to the CloudTower console and go to [Alerts] – [Notification Policies].
- Create a notification policy and select [Webhook Notification].
- Fill in the configuration parameters:
- Request method: POST.
- Push URL: Paste the WeCom bot Webhook address.
- Message format: Markdown structured layout.
#3 Alert Noise Reduction Configuration
- Scheduled silence: Automatically suppress alerts during planned maintenance windows.
- Alert aggregation: Push only one alert of the same type for the same VM within 15 minutes.
- Hierarchical suppression: Critical alerts automatically override and suppress lower-level duplicate notifications.
Configuration Optimization: Building an End-to-End O&M Closed Loop
SmartX ECP also supports adding multidimensional information to push messages, helping O&M teams locate issues at a glance:
- Read VM business tags and identify the associated system.
- Display real-time host load Top data.
- Intelligently recommend the optimal migration node.
- Display the number of recent historical alerts.
After handling a single issue, O&M teams can also incorporate CPU Ready Wait Time Percentage into a long-term performance governance project and continuously optimize VM configurations and cluster resource distribution based on more O&M monitoring capabilities in CloudTower:
- Quarterly performance review: Based on CloudTower’s Inspection Center, enterprises can regularly output performance reports and identify VMs with potential risks.
- Proactive resource forecasting: Based on historical load data, enterprises can predict when CPU bottlenecks may occur and complete full-process optimization before peak periods.
- Automated policies: For non-core business VMs, enterprises can configure automated migration policies after thresholds are exceeded to reduce O&M workload.
You may also be interested in:
Tech FAQ: Why Is CPU Utilization Low, Yet the VMs Keep Lagging?
CPU Resource Partitioning in SmartX ECP: Balancing Between Stability, Performance, and Cost
