As cloud computing has advanced, technologies like network virtualization have made it easier for administrators to centrally manage networks. However, this has also led to increased complexity in network traffic within the cloud. Traditional methods and tools for diagnosing data traffic face challenges when it comes to visualizing and analyzing “east-west traffic” on virtual networks. This creates network blind spots and further complicates issue locating.
To enhance data security and simplify IT O&M, SmartX introduced the Network Visualization functionality. This functionality, which is a key feature of SmartX’s Observability platform (based on CloudTower, SmartX’s multicluster management platform), can visualize VM-VM, VM-host, and host-host network in the cluster, along with other relevant information, allowing O&M engineers to gain a comprehensive understanding of virtual network traffic status.
Intra-Cloud Network Blind Spots: New Visualization Challenges in the Cloud Era
Network data traffic is a crucial aspect of monitoring IT systems. It provides valuable information for O&M engineers to identify potential threats, adjust security policies, and optimize network performance. In the cloud era, understanding the virtual network topology, traffic forwarding path, and network security rule implementation becomes even more important. Compared to physical servers, communication between VMs can be more complex, especially with the increasing number of VMs, VM migrations, and operations like creation, booting, and deletion. Therefore, O&M personnel need to have a comprehensive understanding of the entire virtual network landscape to manage and secure the network effectively.
Traditionally, there are two ways to collect information on data traffic:
- Mirroring mode: Mirroring, copying, and transmitting large numbers of raw network packets to a centralized platform for storage, processing, and analysis. This method has several drawbacks such as inefficiency, complexity in operation, and its ability to only copy packets that pass through specific acquisition devices or interfaces within a limited timeframe. It also necessitates additional computational resources to analyze offline data and locate issues, making it challenging to promptly detect network issues or security attacks. Consequently, this approach is typically employed for post-accident reviewing and collecting evidence. Moreover, if users hope to maintain a copy of the collected data, it also requires a significant amount of additional storage capacity.
- Sampling mode: Periodically sampling data flows in the network based on NetFlow or sFlow, or collecting network-related metrics from network devices.
In these two methods, network status is monitored by collecting packet or data flow information primarily through physical networks and security devices such as switches, routers, firewalls, intrusion detection systems, deep packet inspection tools, and load balancers. These methods were originally developed for traditional data centers that rely on physical servers and physical networks.
In modernized data centers, the majority of data computing, transmission, and storage occur in virtualized environments. This means that communication between VMs, also known as “east-west traffic,” makes up most of the data traffic within the cloud. However, traditional tools face challenges in collecting this data as it does not travel through physical network devices. Only data traffic across clusters can be collected by devices connected to the cluster, such as switches, routers, and firewalls. Even when this data can be collected, there is a lack of automated correlation between the obtained packets, data flow information, network metrics, and VM attributes. Additionally, there is a need for visualization tools to create virtual network topology and analyze data flows.
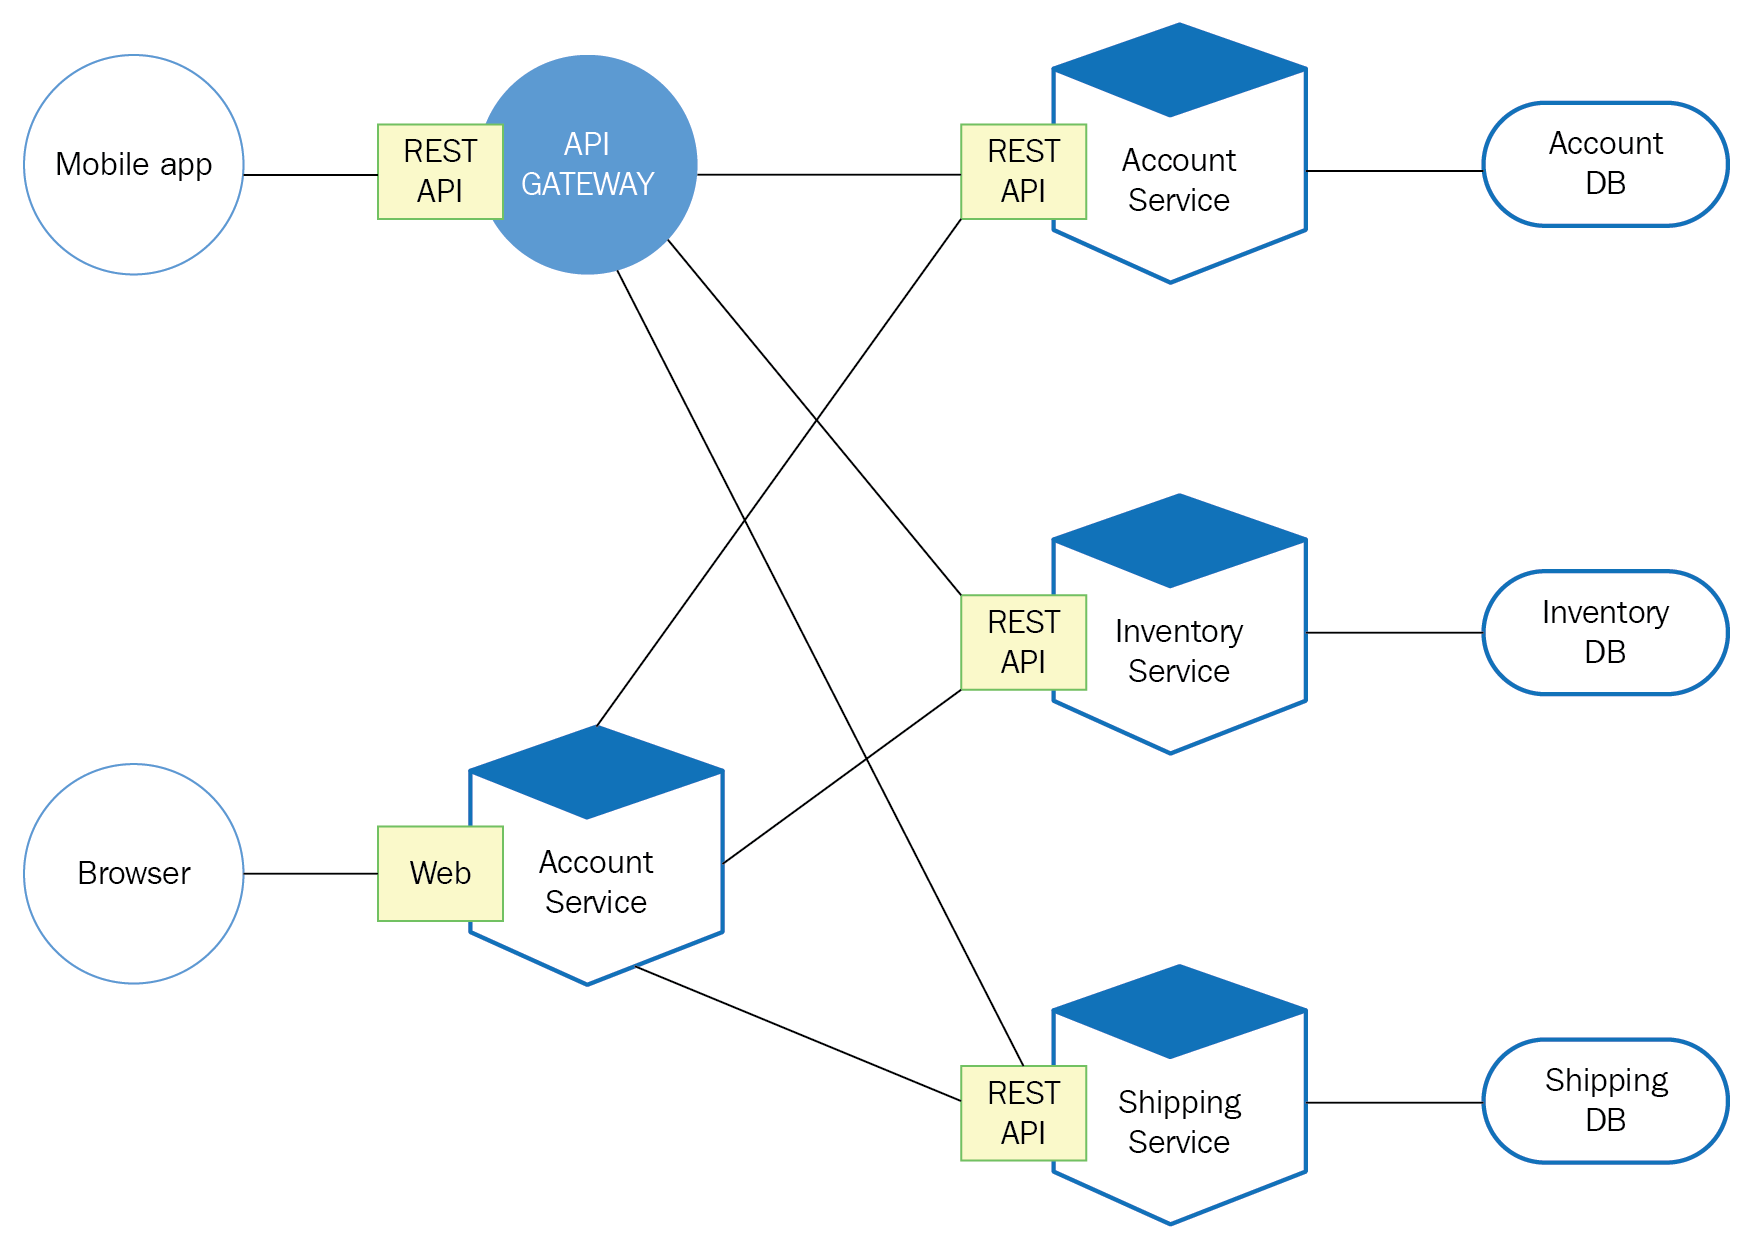
As a result, intra-cloud communications pose a challenge for network visualization, particularly with the increasing use of microservices in modern application architecture. These microservice modules generate “east-west traffic” on the virtualized network (see figure below). Applications gaining popularity such as AI/ML, image processing, and data lakes are also promoting intra-cloud “east-west communication”, both in terms of peak bandwidth and total communication volume far exceeding the previous era.
For such a huge amount of data, it is difficult to use traditional and centralized methods for traffic analysis and visualization. Instead, a distributed and cloud-native detection and visualization tool can be a better choice.
SmartX Network Visualization
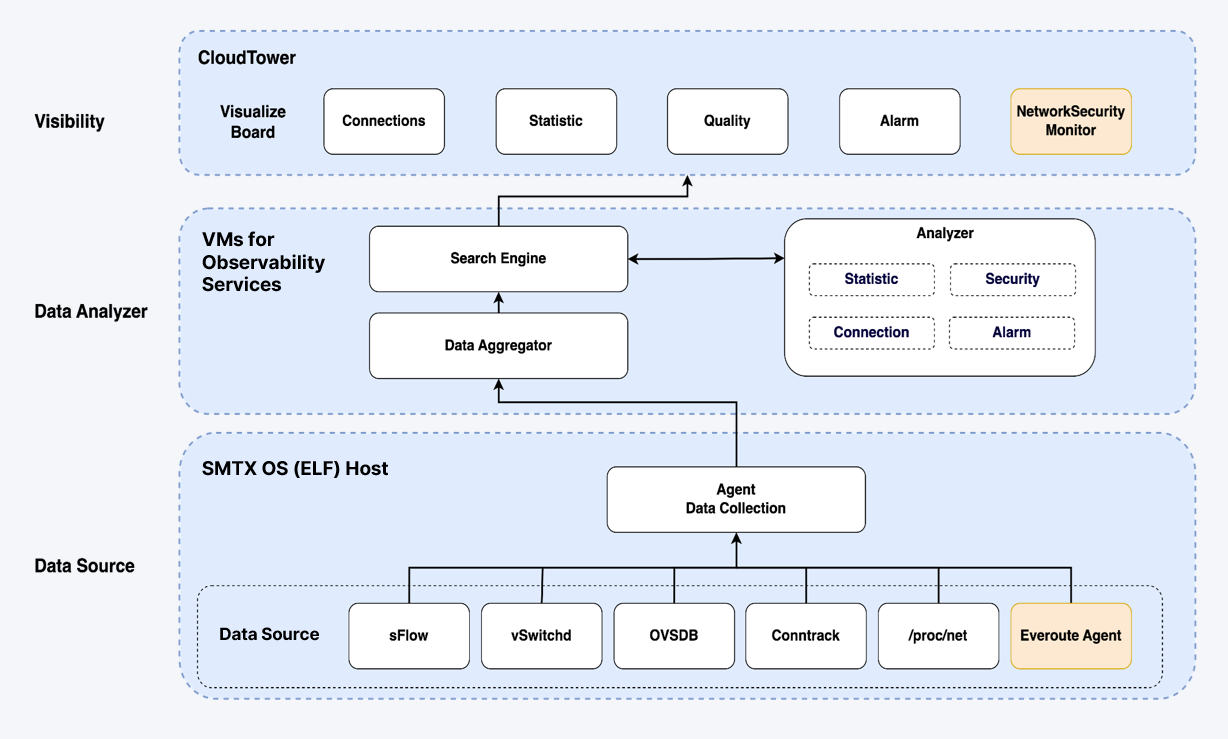
Following this trend, SmartX introduced Network Visualization functionality for virtual networks. Natively supported by SMTX OS, this feature enables real-time collection and analysis of data traffic on virtual networks. By automatically associating data flows with VMs and virtual networks, CloudTower can render visual representations of access relationships between VMs, evaluate network service quality, and monitor network connectivity status, among other functionalities. Concurrently, it extends this visualization capability to the observation of data traffic between VMs and physical devices, particularly storage devices, as well as data flow across servers within the cluster.
With a lightweight distributed collector, Network Visualization only gathers information used for network monitoring and analysis (e.g. connection, statistics, and latency). It does not mirror or store complete network packets. This approach enhances the efficiency of data collection and analysis. Additionally, SmartX’s independently-developed distributed storage can provide high-performance and highly reliable support for data storage and analysis.
Functionalities
Currently, SmartX Network Visualization supports the following functionalities:
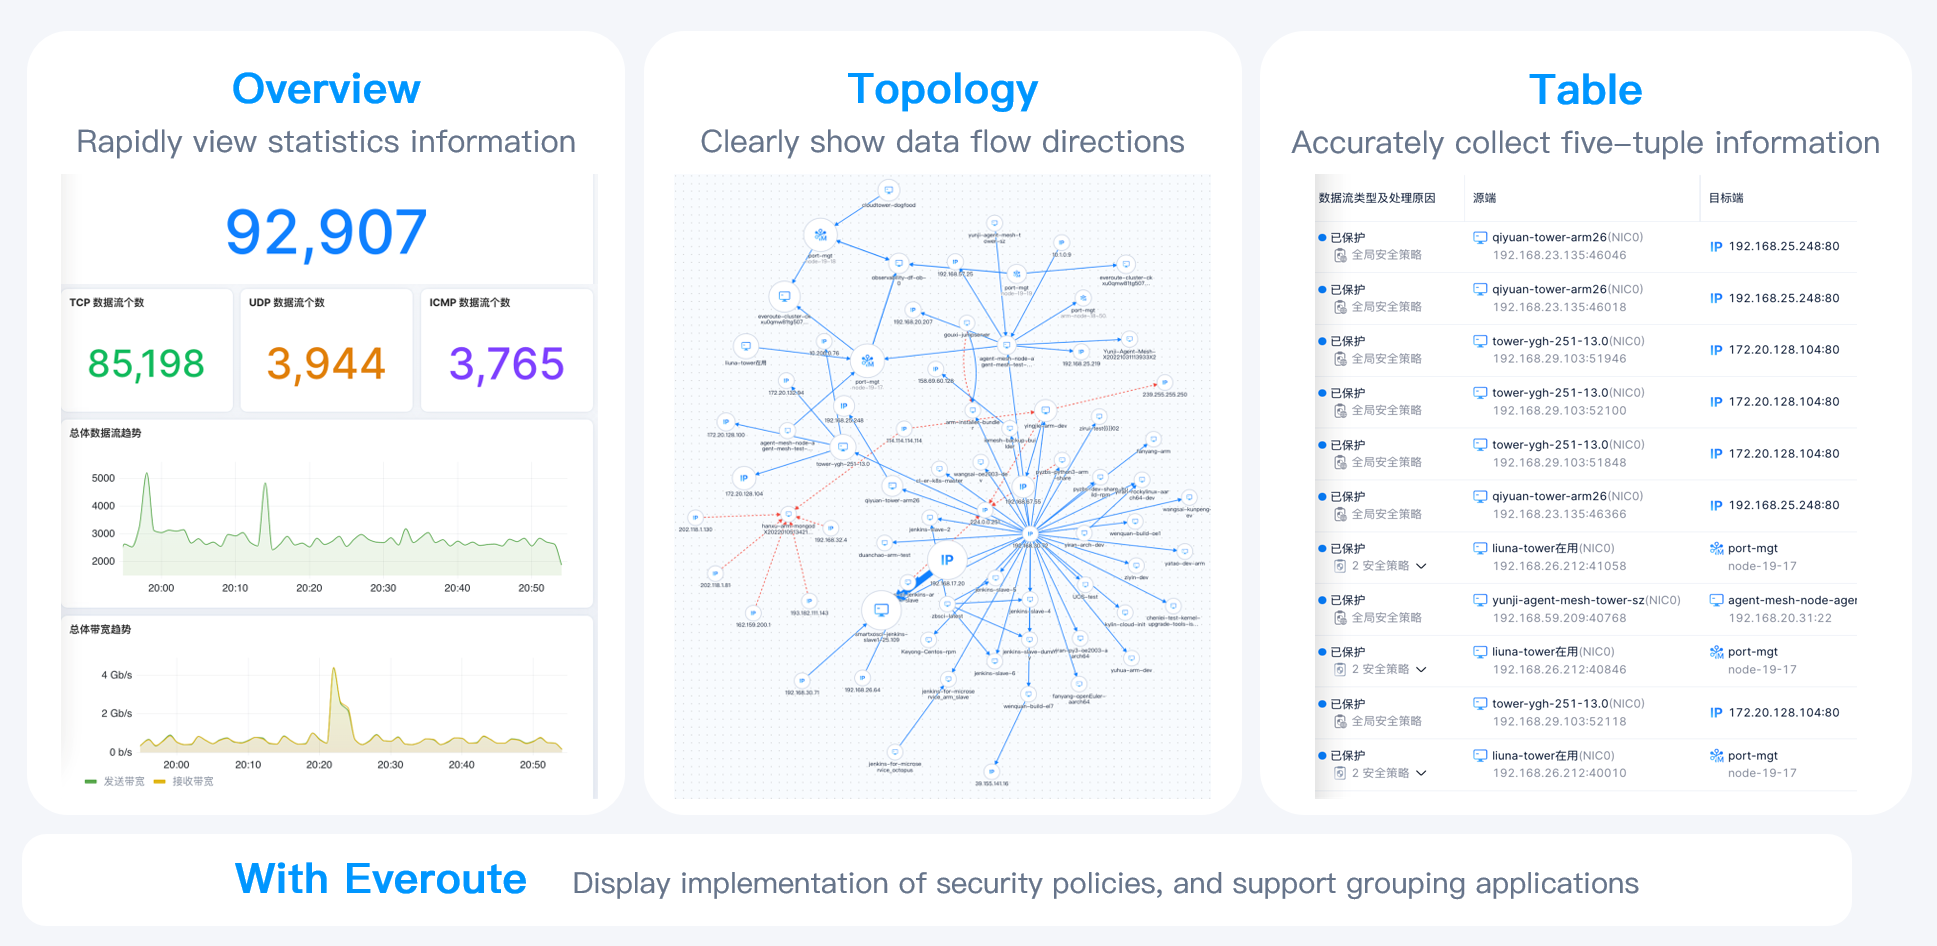
- Support Overview Dashboard to display the overall status of VM networks and system networks.
- Support Topology and Table Dashboard to display detailed information such as the scale, direction, and path of data flow on VM networks, system networks, and between external IP addresses.
- Support automatic identification and alerting of typical network issues.
- Support flexible and numerous data flow filtering methods.
- Can be used with Everoute (SmartX’s distributed firewall product) to display the topology of data flows by security policy grouping, and view the reasons why data flows are allowed or denied by Everoute. This helps users monitor the effectiveness of security policy.
Application Scenarios
Simplify Daily O&M and Inspection Work
With Network Visualization, administrators can monitor real-time network status, and gain insight into the operation of the cluster. This is because the communication busyness among VMs also indicates their capacity usage. Administrators can locate VMs consuming large network bandwidth through the sort of VM data traffic, which also serves as an indicator of cluster status. Users can also limit the bandwidth usage of VMs or set QoS based on management rules to optimize network performance.
Quickly Identify and Locate Network Performance Issues
Network Visualization provides diverse alerts for different network performance issues. Users can customize the trigger conditions of these alerts according to their needs to achieve real-time alarming and issue locating. This will effectively improve troubleshooting efficiency and better meet business continuity requirements.
In addition, Network Visualization allows users to monitor both virtualized networks and physical server networks through the collection and analysis of all network communication metrics related to SMTX OS clusters. Especially for users leveraging HCI, which integrates storage and computing, this function can help them monitor storage network performance, thereby improving O&M efficiency and optimizing storage services.
Security Auditing and Threat Identification
Collaboratively using Network Visualization and Everoute, users can monitor the implementation of security policies, ensuring the effect of security policies meets their expectations. For example, users can verify whether the traffic that should be allowed or dropped is treated correctly. In addition, the graphical topology map can clearly show endpoints that have tried to connect to protected VMs, helping administrators quickly identify attacks or anomalies in the network.
This information gathered by Network Visualization and Everoute can be exported and provided to security operations centers (SOCs). In conjunction with security mechanisms such as NDR/SMDR, enterprises can have an overall insight into virtual cloud network security and flexibly adjust security policies.
Discover Application Topology
In the cloud, active sessions between VMs indicate their communication relationship in the application layer. While open-source code is widely used in application development, the network protocols and port numbers being used are opaque, which becomes potential risks in the production environment.
Network Visualization can comprehensively visualize the communication related to these applications and automatically generate the topology of the data traffic among VMs. With these graphs and topologies, network administrators can divide “application groups” and set appropriate intra-group and inter-group security policies to eliminate blind spots in network and security management.
Maintain Security Policies
In a long-running IT system, as different administrators may set a large number of security policies for different applications, the policies for the whole system will gradually accumulate. However, outdated policies often result in access failures, which is difficult to notice. By monitoring security policies through Network Visualization, administrators can discover outdated policies (i.e., “configuration garbage”) and selectively clean up these configurations to reduce operational risk.
Overall, with Network Visualization, O&M engineers can learn the network status in the cloud more comprehensively and quickly, further enhancing IT system security. Currently, users can deploy Network Visualization on SMTX OS (based on SmartX hypervisor ELF) clusters through CloudTower, and jointly use Everoute to monitor the implementation of security policies.
You may also be interested in:
SmartX Releases CloudTower 2.0: Enhances Simplicity and Security for Operations & Maintenance
Hard Disk Health Check with SmartX HCI: Three Ways to Auto-Detect and Isolate Abnormal Disks
Automatic Data Recovery Policy: Stabilizing Application Performance While Accelerating Data Recovery
Unprecedented Scalability: Explore SmartX HCI’s Flexible Scale-out Options
How to achieve seamless and zero-downtime upgrade of IT infrastructure software and hardware?
Reuse Existing Devices with SmartX HCI: 4 Customers Achieve IT Infra Transformation at a Lower Cost