Selecting an HCI solution that is right for your business is not an easy task. To make the best choice, you may need to collect a lot of information about the products, compare their features, understand how they work, and evaluate their performance. This work can be tedious and inefficient.
If you’ve encountered the same problem, this article might be helpful. Following is a comparison of Nutanix and SmartX HCI in terms of offerings, storage architecture, and performance. While both Nutanix and SmartX HCI solutions are comprised of similar products based on similar architecture, SmartX HCI clearly outperforms Nutanix HCI in a variety of scenarios.
Products
Below is the comparison of core features and products of Nutanix and SmartX HCI solutions.
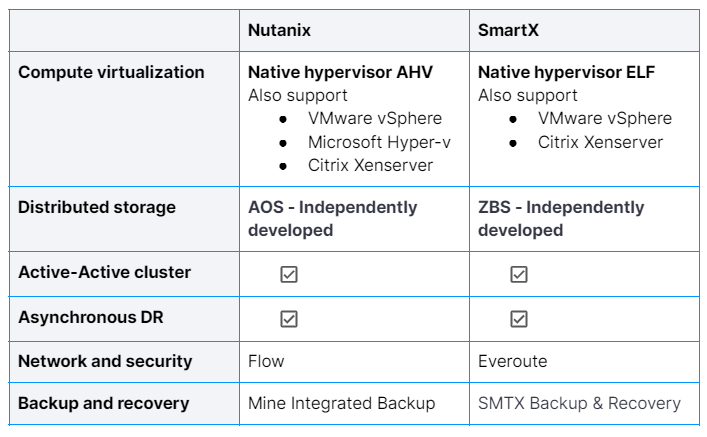
Nutanix and SmartX HCI solutions share many similarities: both have independently developed product portfolios: distributed storage, hypervisor, HCI with multiple-hypervisor support, disaster recovery, network and security, and backup.
Storage Architecture
Currently, distributed storage architecture is divided into two categories: those based on Ceph, an open-source technology, and those based on independently developed technologies. Nutanix and SmartX have both independently developed storage architectures based on GFS (Google File System).
To learn more about SmartX distributed block storage architecture, please refer to our previous blog of ZBS.
In general, designing distributed storage architecture entails three components: metadata service, data storage engine, and consistency protocol.
Cluster Core Component Relationships
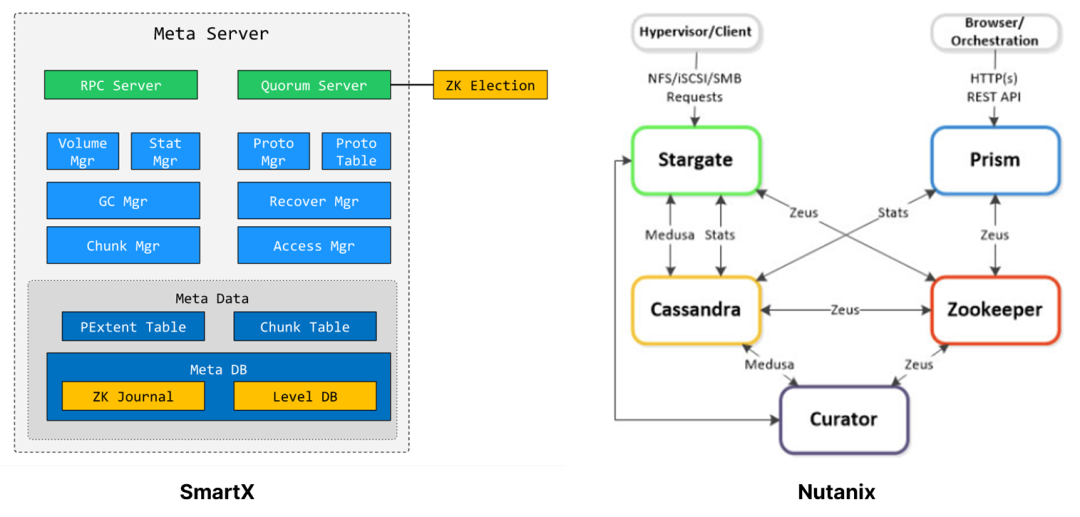

While the two solutions use similar components for various services, ZBS has implemented technological enhancement for some core components such as the metadata service. This is because both Zookeeper and Cassandra have some shortages. On the one hand, Zookeeper has very limited data storage capacity and cannot be used in conjunction with data services. Cassandra, on the other hand, lacks an ACID mechanism, which increases the complexity of upper-layer implementation and thus requires additional effort. ZBS, however, combines LevelDB and Zookeeper, making this service more reliable, high-performance and lightweight.
Storage Data Structure
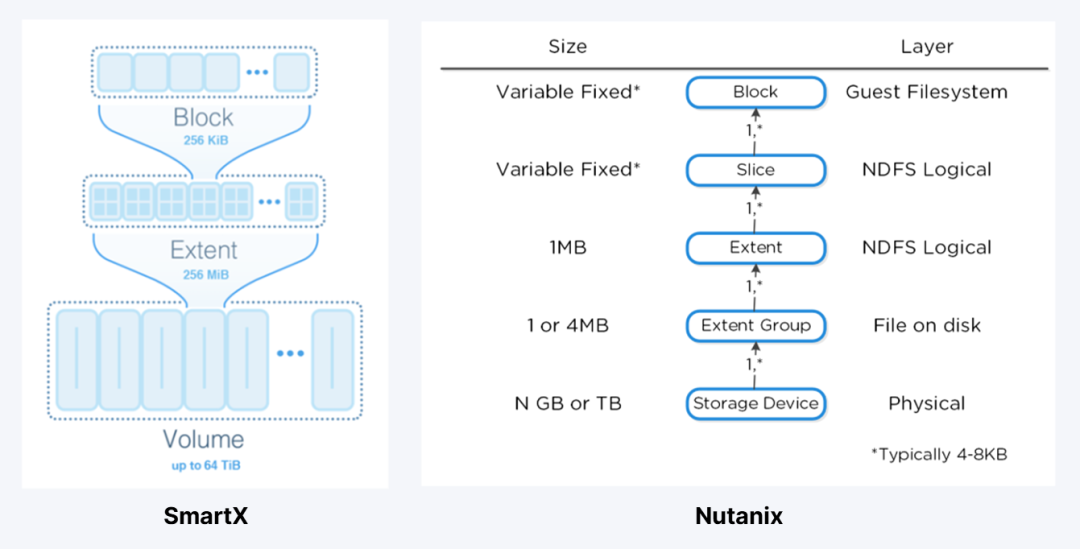
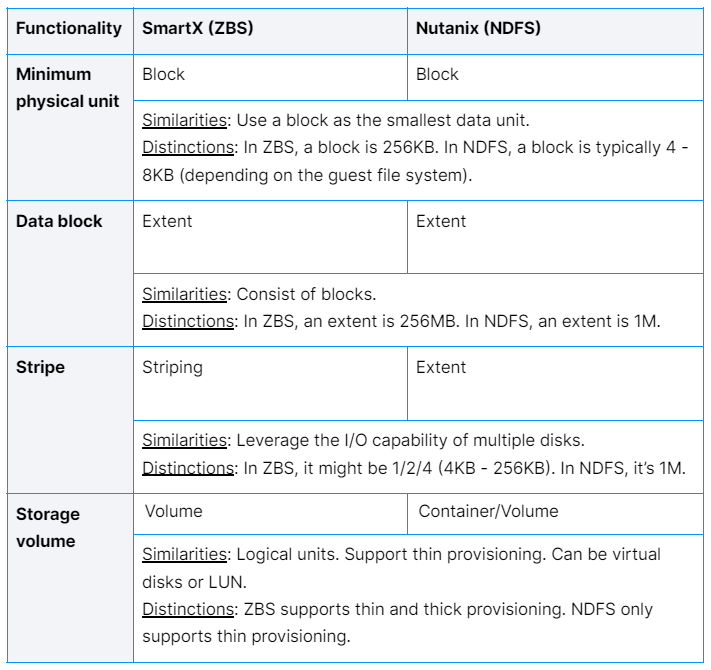
The two solutions adopt different block unit sizes. ZBS uses a data unit (extent) of a larger granularity, which can improve access efficiency by reducing the memory resources consumed by metadata and ensuring that all metadata can be stored in memory. Notably, ZBS also supports thick provisioning.
I/O Path
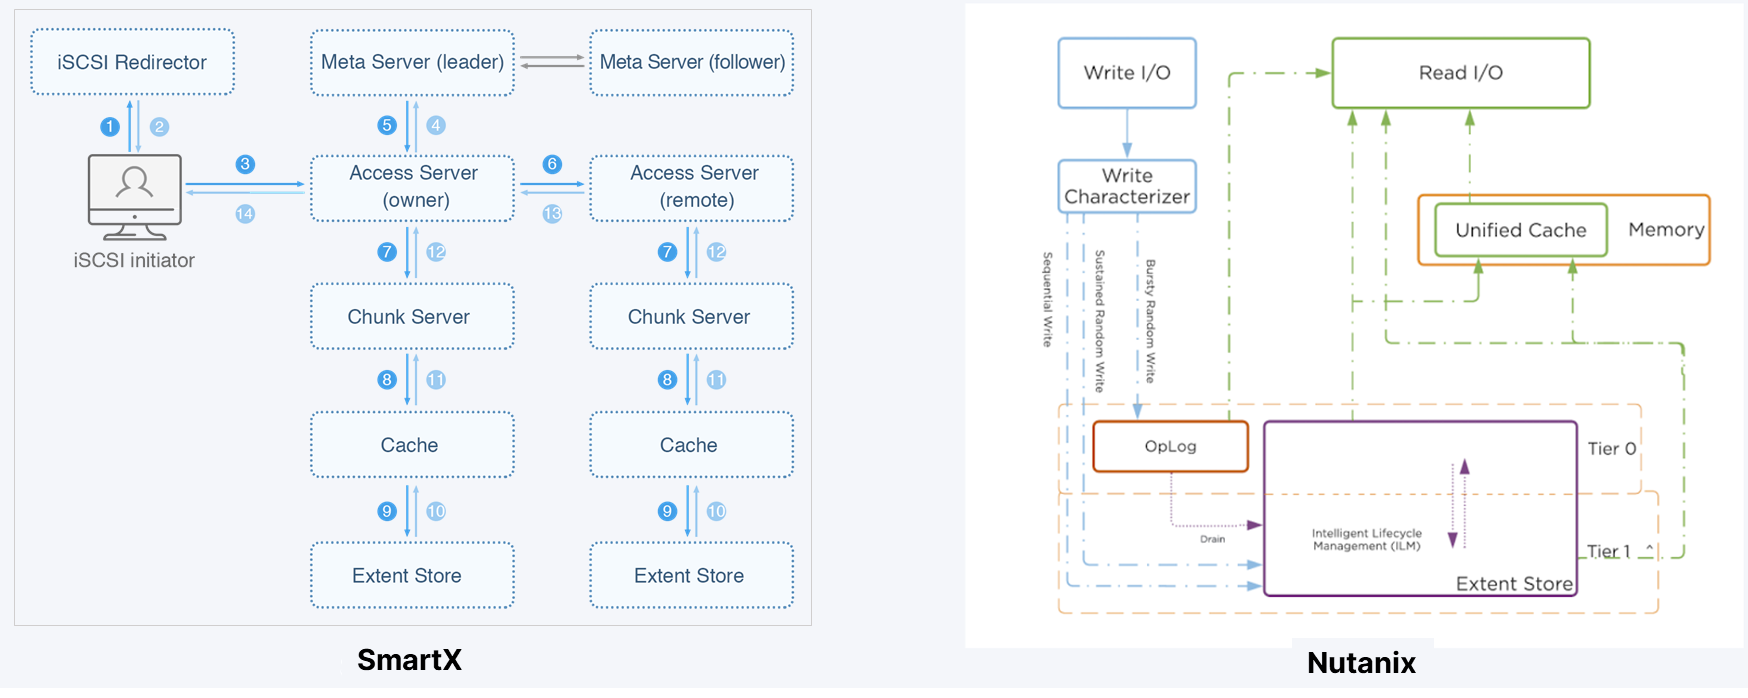
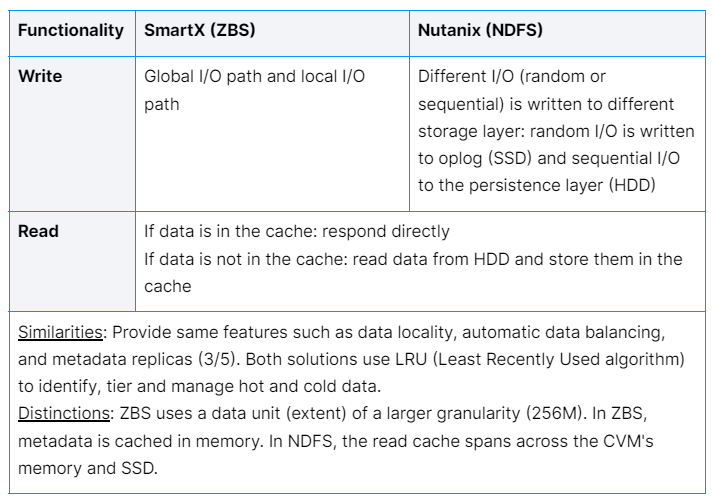
Both solutions share similar features concerning I/O path such as automatic tiering of data, data locality, and automatic data balancing. However, ZBS can be more efficient as its metadata is cached in memory. This speeds up the response of operations concerning metadata. Moreover, as all nodes have a replica of the metadata, metadata won’t be lost even if some servers encounter the downtime.
Data Redundancy Mechanism
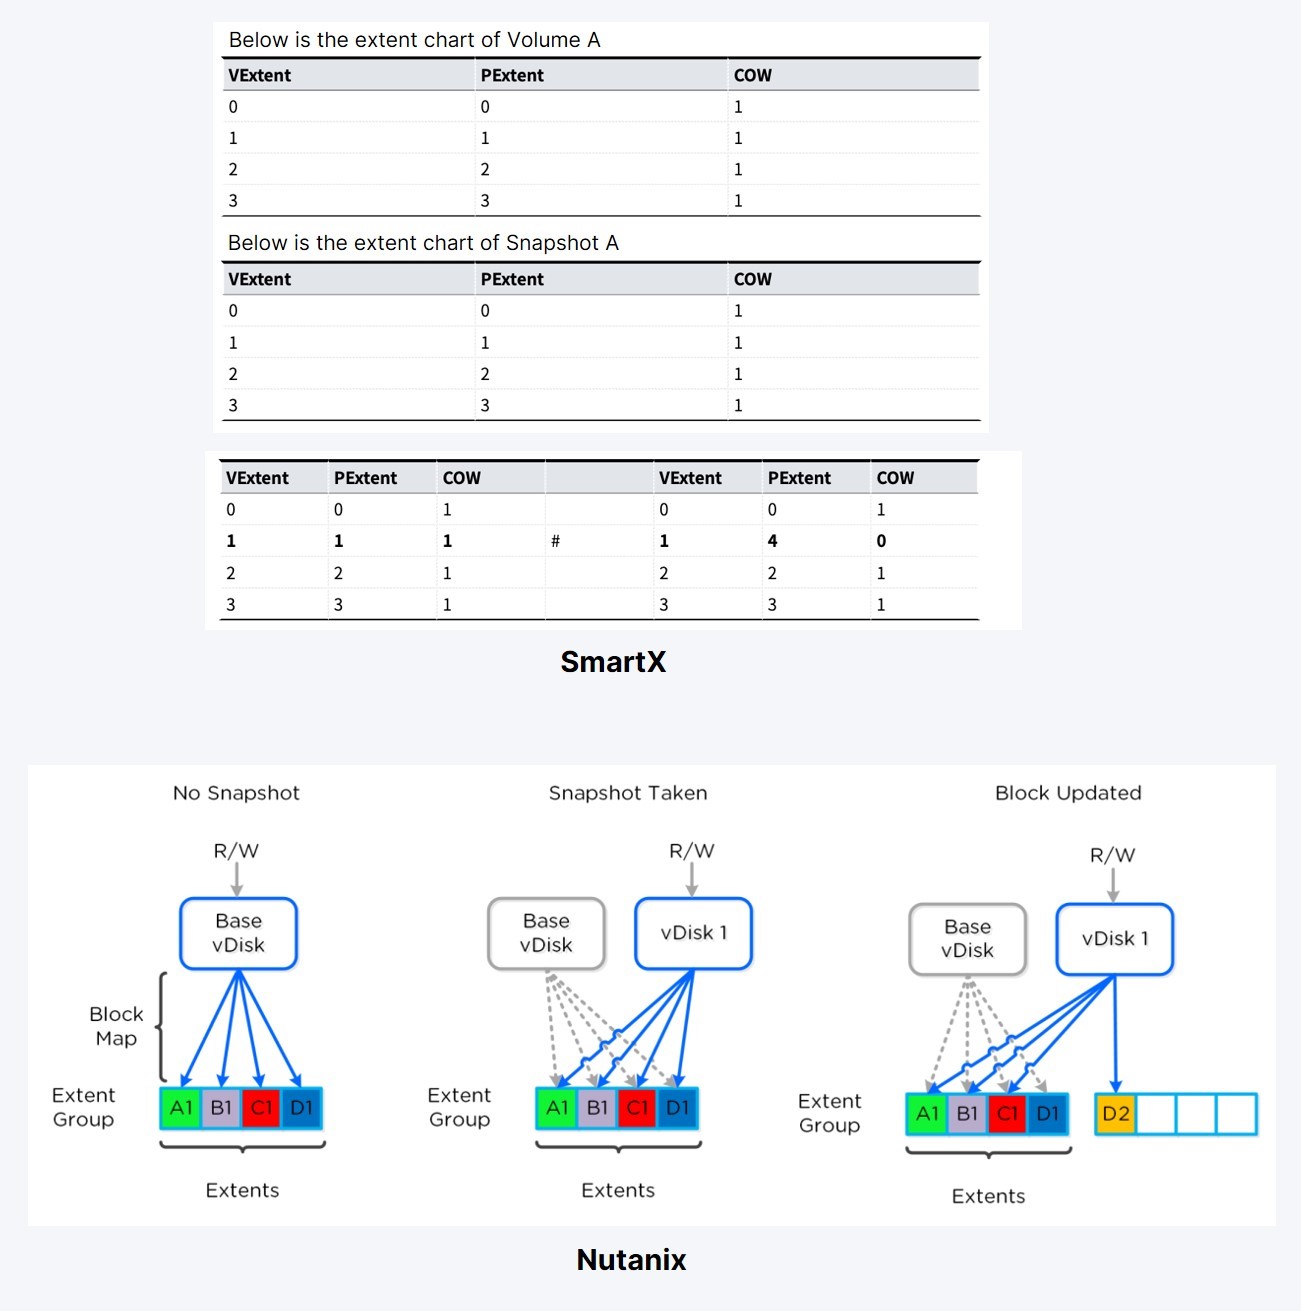
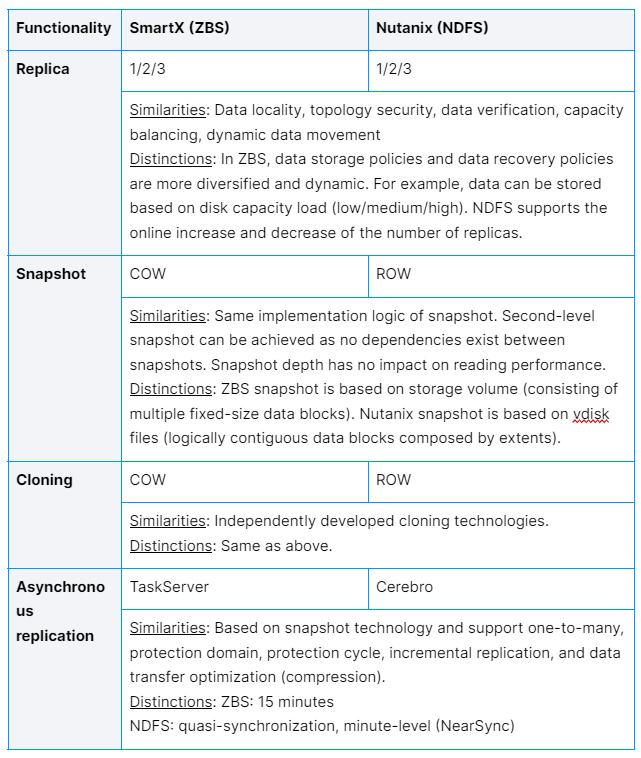
Both solutions use similar technologies for data protection. But ZBS’s replica allocation policies are more diversified. For example, it enables localization and dynamic adjustment of strategies (based on the size of the storage capacity space share). Also, as the metadata of ZBS snapshots is stored in the metadata service cluster, it can be more responsive and enables data to be persistently synchronized to SSD media. Even if a host is rebooted, metadata can be quickly loaded into memory via SSD without causing snapshot performance degradation.
For more information about metadata storage and snapshot mechanism, please refer to our previous blog on VMware and SmartX snapshots.
Performance
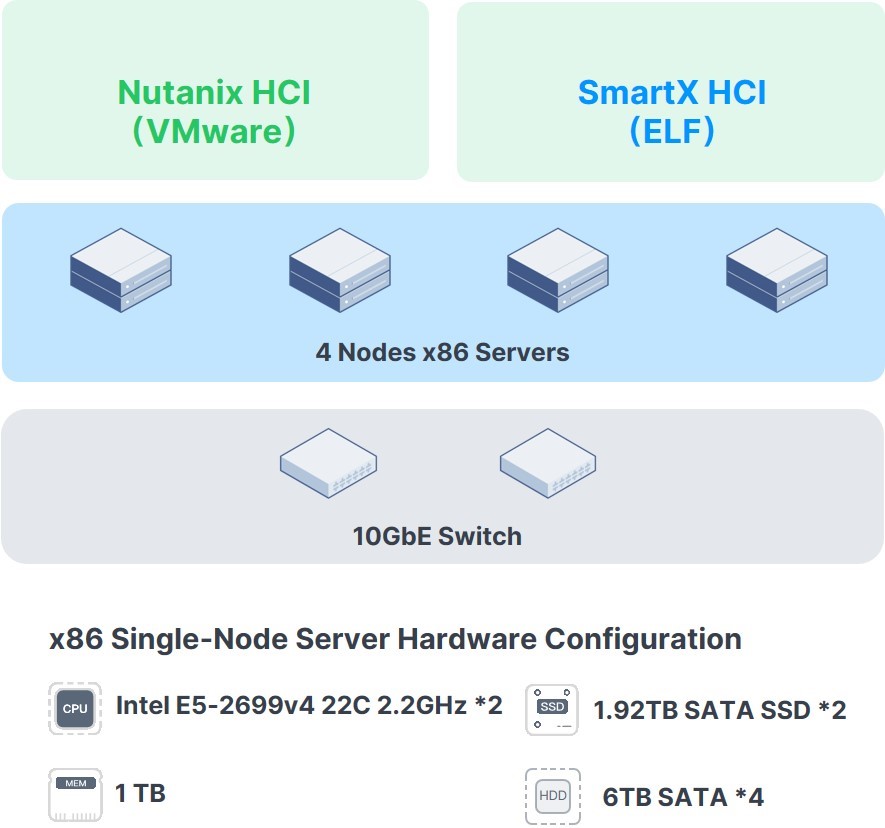
We conducted several performance tests on SmartX HCI (SMTX OS 5.0.3) and Nutanix HCI (AOS 5.20.4.6). The following examinations were based on the same physical devices and environments.
Note: In the tests, SmartX HCI used ELF and enabled boost mode. Nutanix HCI used VMware ESXi 6.7u3B.
FIO Test
Full-disk data writes were performed on the 100GB data disks of each VM. Then we did 4P1V and 4P4V performance tests of data disks based on different I/O models.
- 4P1V means 1 VM running on 4 nodes, with only one VM performance being evaluated. It simulates the performance of a single business system in the cluster.
- 4P4V means 4 VMs distributed on 4 different nodes, with four VM performance being evaluated. It simulates the performance of the entire cluster.
Test Environment
Results
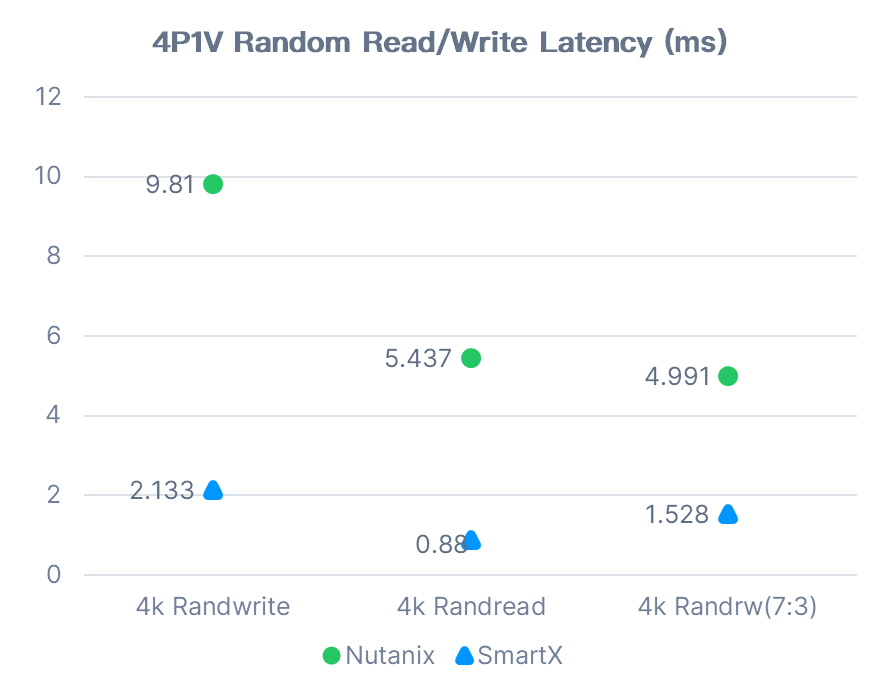
4P1V Random Read/Write
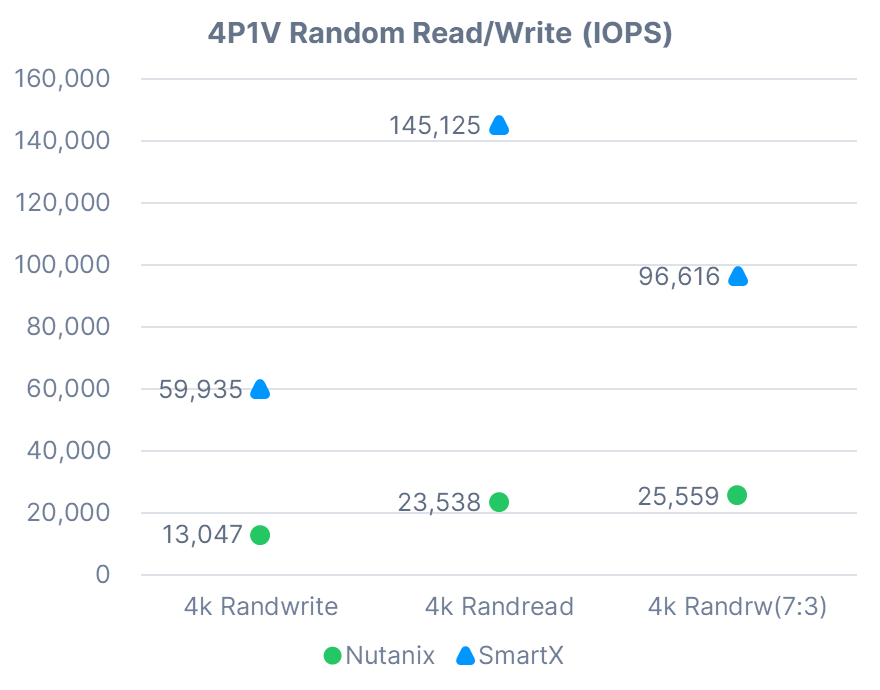
Note: In the mixed-read-and-write performance test (4k Randrw 7:3), Nutanix HCI read IOPS was 17,885 and write IOPS 7,674. SmartX HCI read IOPS was 67,633 and write IOPS 28,983.
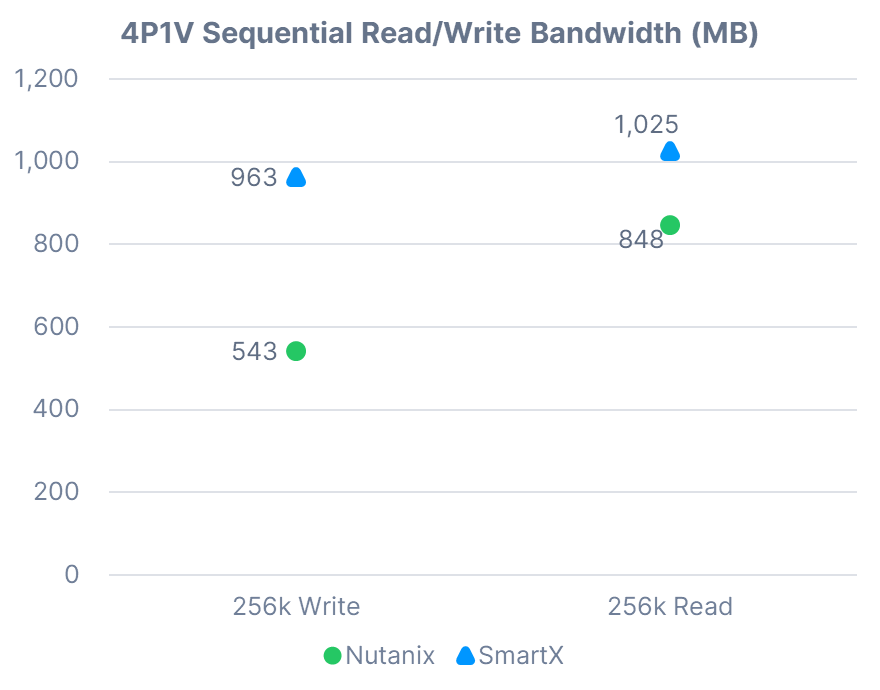
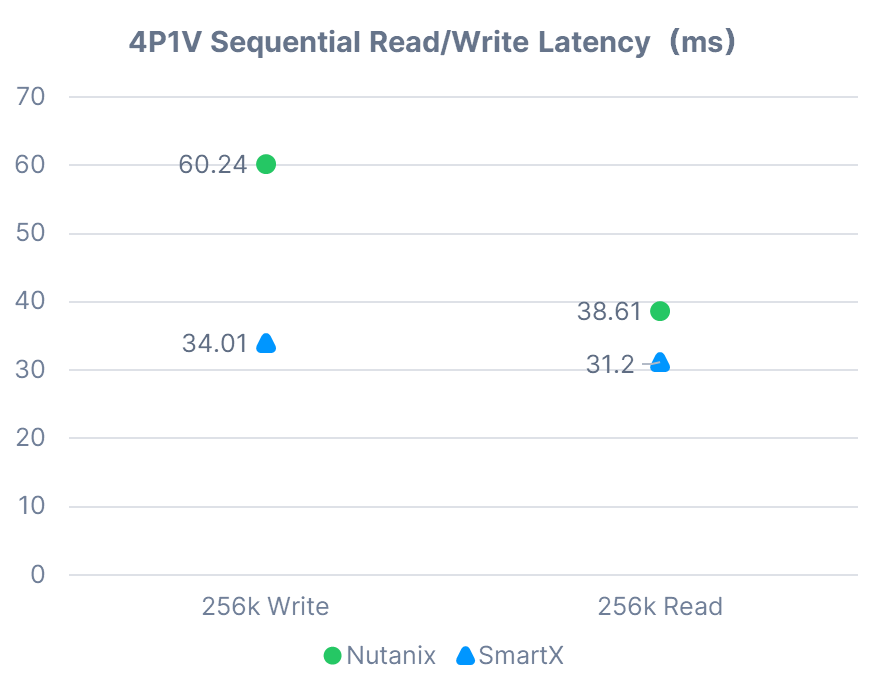
4P1V Sequential Read/Write
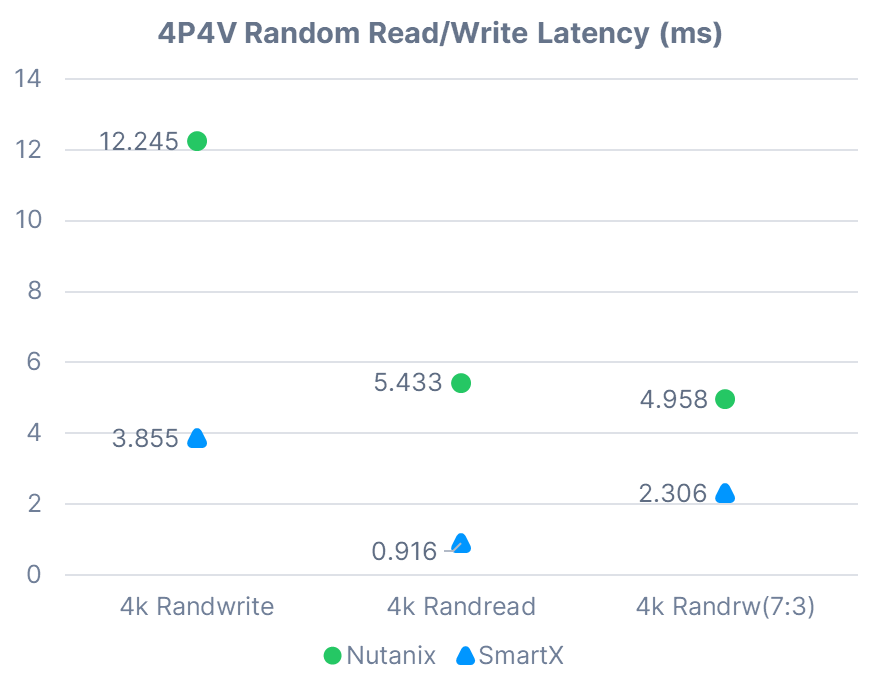
4P4V Random Read/Write
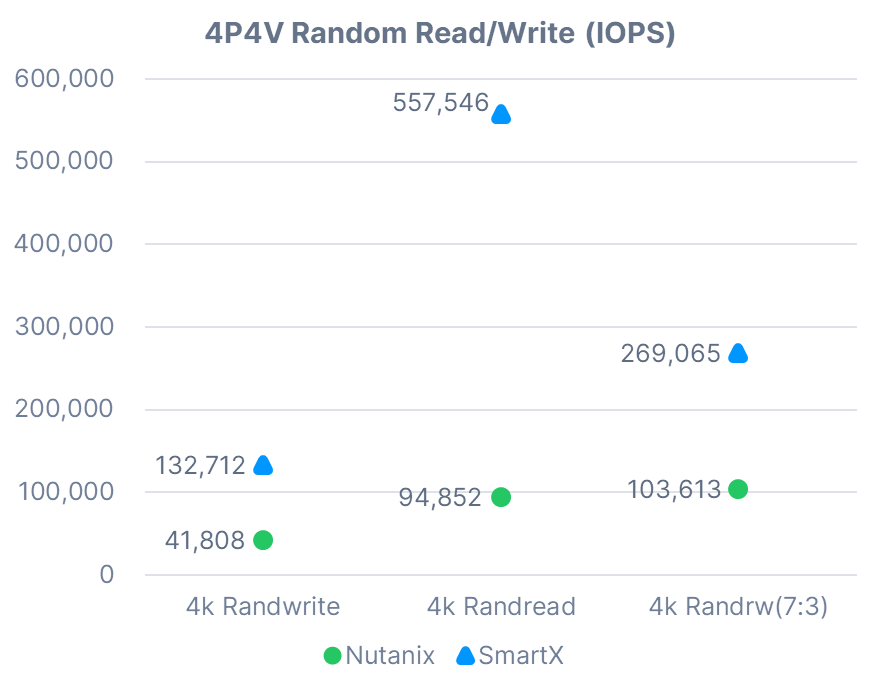
Note: In the mixed-read-and-write performance test (4k Randrw 7:3), read IOPS for 4 VMs in Nutanix HCI were 17,738, 18,035, 18,426 and 18,330, and write IOPS 7,623, 7,718, 7,881 and 7,862. Read IOPS for 4 VMs in SmartX HCI were 48,193, 46,668, 46,466 and 46,997, and write IOPS 20,655, 20,001, 19,929 and 20,156.
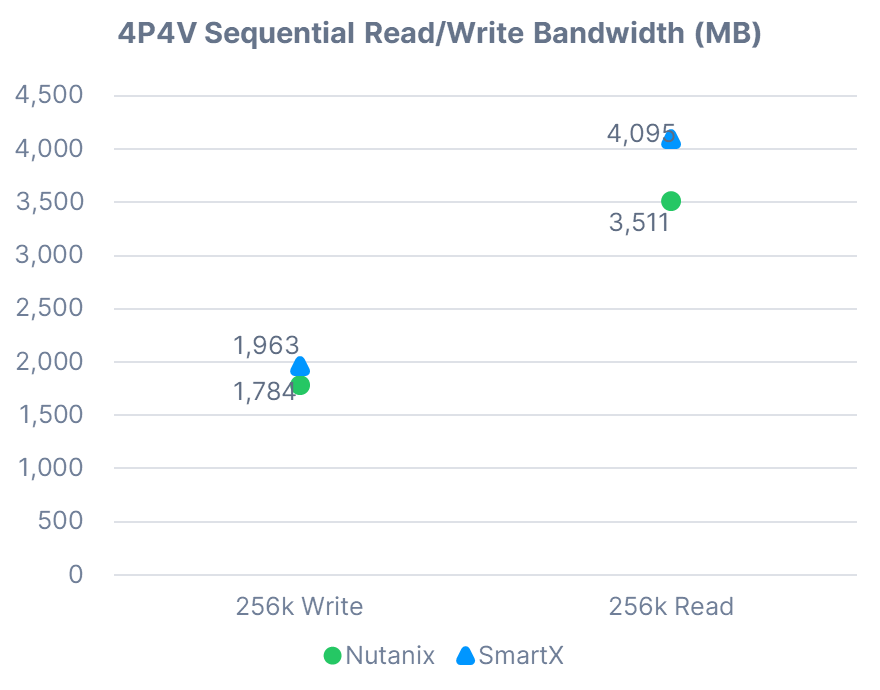
4P4V Sequential Read/Write
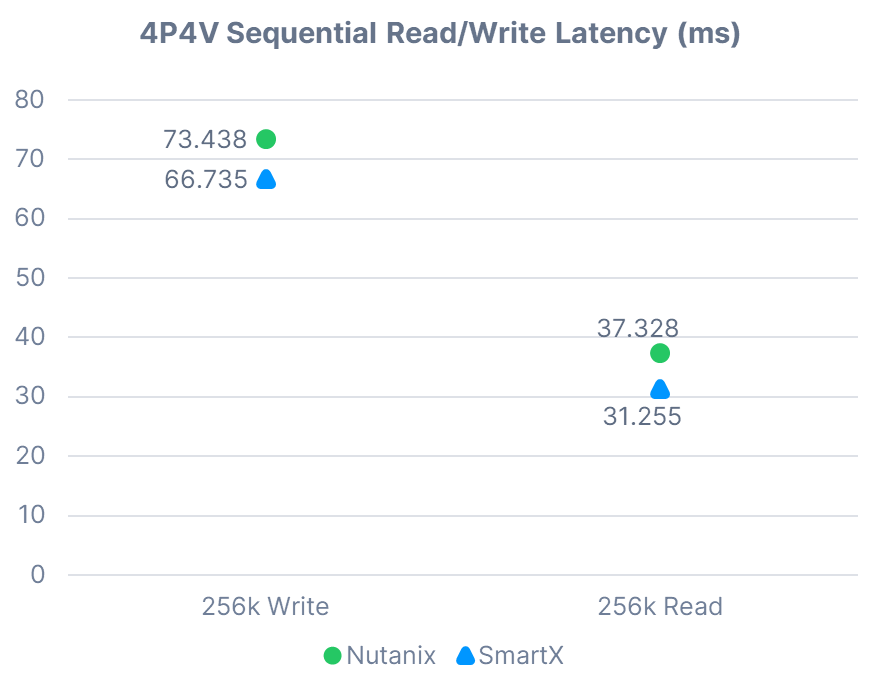
Conclusion
It is clear that under the same conditions, SmartX HCI outperformed Nutanix HCI in all of the test cases above.
To wrap up
Through the lens of product, storage architecture and performance, we can find that Nutanix and SmartX provide HCI services with similar features and storage architectures. Meanwhile, perhaps due to technology enhancements in several important aspects, SmartX HCI demonstrates better performance than Nutanix.
If you want to know more about how well SmartX HCI performs compared with other solutions, read this collection of VMware and SmartX features and performance comparisons.
Notices and Disclaimers:
Nutanix is a trademark of Nutanix, Inc., registered in the United States and other countries. All other brand names mentioned herein are for identification purposes only and may be the trademarks of their respective holder(s).
Performance tests are measured using specific computer systems, components, software, operations and functions. Any change to any of those factors may cause the results to vary. You should consult other information and performance tests to assist you in fully evaluating your contemplated purchases.